Rate limiter with Caddy and fail2ban
Here I describe how to configure fail2ban (commonly used to defend against unauthorized access attempts) to limit the number of successful accesses within a defined time window. This is called “rate limiting” and is intended to thwart denial of service attacks that overload my server.
Enabling Caddy Logs
First, we need to enable the web server’s logger. With Caddy, this can be done with just a few lines of code that I add to my existing configuration:
# caddy2/config/Caddyfile

blog.schallbert.de {
# Define webserver
root * /www/blog
encode gzip
file_server

# Enable logging for fail2ban
log {
output file /log/blog/access.log
}

# [...]
From now on, logs will be created in the specified path, which I manage with a logrotate configuration.
Configuring Fail2ban as a Rate Limiter
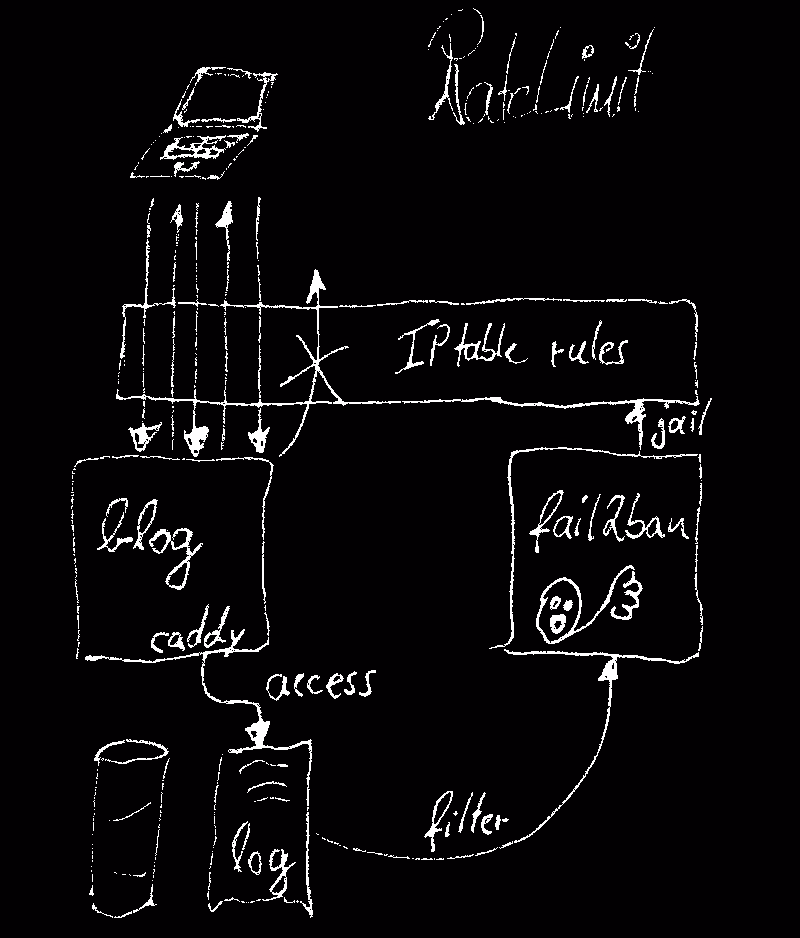
To recap: fail2ban accesses the machine’s packet filter rules and, in effect, modifies its firewall to ward off dynamic attacks. For this to work, fail2ban must be provided with log files generated by a host application, such as a web server, that contain the IP addresses of the client computers.
Preliminary consideration: “http 200 OK” as a filter?
Even normal, permitted accesses 200 OK must count for my rate limiter.
To get a feel for how my logger records accesses, I take a look at the logs. I get the number of entries that contain a status of 200 OK returned. To do this, I perform a search with grep and calculate the number of hits line by line using wc -l.
schallbert@machine:/var/log/caddy2/blog# grep -o '"status":200' access.log | wc -l
847
Okay, so there have already been 847 hits today, which received a 200 OK response. Now I’ll call up my blog’s landing page and display the article overview.
schallbert@machine:/var/log/caddy2/blog# grep -o '"status":200' access.log | wc -l
858 // after calling blog.schallbert.de
schallbert@machine:/var/log/caddy2/blog# grep -o '"status":200' access.log | wc -l
882 // page loaded after clicking "Posts" button
Wow, that was 35 entries for two clicks! Looking at the log, it explains the many lines of assets—images and logos—that are being loaded.
Unfortunately, this makes it clear that the filter criterion status:200 for my rate limiter can’t work without further ado. The number of notifications depends largely on the respective article. So, I would have to define a threshold above which no normal person would generate access to my blog.
In order to count only “real” accesses to my pages, I have to somehow exclude the assets from the logs. Fortunately, there’s a simple directive in Caddy for this.
# caddy2/config/Caddyfile

 # Enable logging for fail2ban
   log_skip /assets*
   log {
    output file /log/blog/access.log
  }
log_skip now ensures that all accesses to files in the assets/ folder and below are not logged.
The behavior of Fail2ban is defined using two configuration files:
Directory filter.d
filter.d/<filter-name>.conf contains the definition of an event to be monitored. Thus, the failregex “page not found” http 404 status code can be used to trigger the packet filter, just as successful access can be used to set up my rate limiter, which responds to 200 OK. I copied the regex from Rafael Kassner.
# /opt/fail2ban/config/filter.d/caddy-ratelimit.conf

[Definition]
failregex   = "client_ip":"<HOST>"(.*)"status":200
datepattern = \d+
ignoreregex =
In addition, further boundary conditions are defined in the file, e.g., the date format datepattern is adapted to the log output of the system to be protected.
jail.local file
jail.local determines the conditions under which the packet filter for the client IP becomes active and blocks further access attempts. For use as a rate limiter, I need the following fields:
findtime - the time window in which attacks are counted, maxretry is the number of permissible attempts in the time window, and bantime is the time for which the attack is blocked. ignoreip is usually preconfigured to the relevant internal IP addresses by default. In my case, act_runner, for example, sends a message to gitea internally to query whether any new automation tasks are pending. I definitely don’t want to interfere with these accesses.
The example for fail2ban used below shows the rate limiter on my blog. In the end, the files and log entries for gitea are essentially the same. Only the filter names and parameters differ due to the different requirements of the website and the DevOps platform.
# /opt/fail2ban/jail.local
# ...

[caddy-ratelimit]
enabled     = true
chain       = DOCKER-USER
action      = iptables-multiport
port        = http,https
filter      = caddy-ratelimit
logpath     = /var/log/caddy2/blog/access.log
findtime    = 20s
maxretry    = 10
bantime     = 6h
Once these two files are configured, you can restart fail2ban and view the logs. If there are still errors in the files, fail2ban will output the following:
ERROR Errors in jail 'caddy-ratelimit'. Skipping...
If this occurs, for example, the jail cannot be assigned to the filter (must have the same name!), a field definition such as maxretry is incorrectly typed, or a number format cannot be read. If everything is working correctly, the entry will be:
Reading config files: /etc/fail2ban/filter.d/caddy-ratelimit.conf
Testing the Rate Limiter
Now I want to check if everything is working as expected.
Checking the Filter Regex
The first step is to look at the filter term and check whether it can be reliably found in the logs. Conveniently, fail2ban has a built-in tool for this: fail2ban-regex <logfile> <filter>. So I can simply enter the filter file and a test log file and see if I get any matches.
fail2ban-regex ./access.log /etc/fail2ban/filter.d/caddy-ratelimit.conf

Running tests
=============

Use      filter file : caddy-ratelimit, basedir: /etc/fail2ban
Use      datepattern : \d+ : \d+
Use         log file : ./access.log.2
Use         encoding : UTF-8

Results
=======

Failregex: 2009 total
|-  #) [# of hits] regular expression
|   1) [2009] "client_ip":"<HOST>"(.*)"status":200
`-

Ignoreregex: 0 total

Date template hits:
|- [# of hits] date format
|  [2685] \d+
`-

Lines: 2685 lines, 0 ignored, 2009 matched, 676 missed
[processed in 0.12 sec]
Quantitatively, I get what I expect: the search procedure described above using grep gives me exactly the same results.
Check Jail
The next step is to test whether the rate limiter is working. To do this, I simulate log entries. I significantly ease jail rules for this test, otherwise I’ll have to generate too many entries in a short period of time.
# /opt/fail2ban/jail.local TEST
# ...

[...]
findtime    = 10s
maxretry    = 2
bantime     = 100s
After restarting fail2ban, I create a second console where I can simulate log entries. This must include at least the time, IP address of the caller, and status; however, I play it safe and use complete entries.
echo '{"ts":1751246139,"remote_ip":"1.1.1.1","status":200,[superLongIrrelevantOtherStuffForFiltering]}' >> /var/log/caddy/blog/access.log
I enter this multiple times to exceed my limit of 2 retries.
In the first console instance, I then check the fail2ban status for the corresponding filter.
fail2ban-client status caddy-ratelimit
Status for the jail: caddy-ratelimit
|- Filter
| |- Currently failed: 0
| |- Total failed: 0
| `- File list: /var/log/caddy2/blog/access.log
`- Actions
|- Currently banned: 0
|- Total banned: 0
`- Banned IP list:
That was nothing. The fail2ban log file reveals why:
# /fail2ban/config/log/fail2ban/fail2ban.log
WARN [caddy-ratelimit] Ignoring all log entries older than 20s; # probably messages generated within a fail2ban restart period
So again with appropriate timestamps. I have to get these from the current system time ($(date +%s.%N)) if I have to constantly adjust it. Therefore, I take a complete log line, modify it to the IP address 1.1.1.1, and insert appropriate timestamps:
echo "{\"level\":\"info\",\"ts\":$(date +%s.%N),\"logger\":\"http.log.access.log0\",\"msg\":\"handled request\",\"request\":{\"remote_ip\":\"1.1.1.1\",\"remote_port\":\"38229\",\"client_ip\":\"1.1.1.1\",\"proto\":\"HTTP/1.1\",\"method\":\"GET\",\"host\":\"blog.schallbert.de\",\"uri\":\"/vacuum-clamping/\",\"headers\":{\"Accept-Encoding\":[\"gzip, deflate, br\"],\"Connection\":[\"keep-alive\"],\"User-Agent\":[\"Mozilla/5.0 (Windows NT 10.0; Win64; x64) AppleWebKit/537.36 (KHTML, like Gecko) Chrome/121.0.0.0 Safari/537.36 Edg/121.0.0.0\"],\"Accept\":[\"text/html,application/xhtml+xml,application/xml;q=0.9,image/webp,*/*;q=0.8\"],\"Accept-Language\":[\"en-US,en;q=0.5\"]},\"tls\":{\"resumed\":false,\"version\":772,\"cipher_suite\":4865,\"proto\":\"http/1.1\",\"server_name\":\"blog.schallbert.de\"}},\"bytes_read\":0,\"user_id\":\"\",\"duration\":0.001207354,\"size\":12290,\"status\":200,\"resp_headers\":{\"Last-Modified\":[\"Tue, 10 Jun 2025 19:33:01 GMT\"],\"Content-Encoding\":[\"gzip\"],\"Server\":[\"Caddy\"],\"Alt-Svc\":[\"h3=\\\":443\\\"; ma=2592000\"],\"Vary\":[\"Accept-Encoding\"],\"Etag\":[\"\\\"gzip\\\"\"],\"Content-Type\":[\"text/html; charset=utf-8\"]}}" >> access.log
After calling this command several times, I now get
Status for the jail: caddy-blog-ratelimit
|- Filter
|  |- Currently failed:	1
|  |- Total failed:	11
|  `- File list:	/var/log/caddy2/blog/access.log
`- Actions
   |- Currently banned:	1
   |- Total banned:	4
   `- Banned IP list:	1.1.1.1
That looks great.
Check packet filter
Phew, finally done! This is how fail2ban.log looks like right now. It shows [caddy-ratelimit] entries as expected:
schallbert@machine:~# nano /fail2ban/config/log/fail2ban/fail2ban.log

 <timestamp> <id> INFO  [caddy-ratelimit] Found <IP a>
 <timestamp> <id> INFO  [caddy-status] Found <IP b>
 <timestamp> <id> INFO  [caddy-ratelimit] Ignore 172.18.0.1 by ip
 <timestamp> <id> INFO  [caddy-status] Ignore 172.18.0.1 by ip
 <timestamp> <id> INFO  [caddy-ratelimit] Found <IP c>
 <timestamp> <id> INFO  [caddy-ratelimit] Found <IP c>
 <timestamp> <id> INFO  [caddy-status] Found <IP c>
 <timestamp> <id> INFO  [caddy-status] Found <IP c>
 <timestamp> <id> INFO  [caddy-ratelimit] Found <IP d>
 <timestamp> <id> INFO  [caddy-status] Found <IP d>
 <timestamp> <id> INFO  [caddy-status] Found <IP e>
 <timestamp> <id> INFO  [caddy-ratelimit] Found <IP e>
 <timestamp> <id> INFO  [caddy-ratelimit] Found <IP f>
To test the entire chain, we now need to check whether the corresponding IP address is actually blocked in the hardware. To do this, I enter:
schallbert@machine:~# iptables -n -L | grep "1.1.1.1"
REJECT all -- 1.1.1.1 0.0.0.0/0 reject-with icmp-port-unreachable
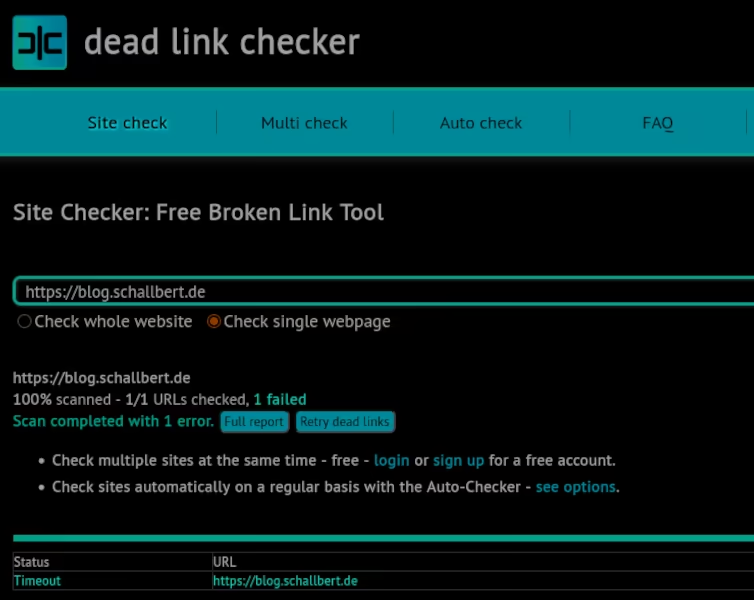
Everything seems to be fine. For one final test from an external IP address, I call a Link Checker in the browser, which should crawl my website and thus trigger the rate limiter. Although it crawls 44 links in a very short time, the test is displayed as “passed.” Very strange, [caddy-ratelimit] should have triggered!
iptable-chain INPUT instead of FORWARD
Confused, I take a look at the entire iptable. At the same time, I look up the IP address of the link checker. It appears in the iptables. And yet, it’s apparently not blocked. Why is that? A closer look shows:
Chain INPUT (policy ACCEPT)
target prot opt source destination
f2b-caddy-ratelimit tcp -- 0.0.0.0/0 0.0.0.0/0 multiport dports 22
The problem here is that my jail is on the INPUT chain. However, the requests don’t go directly to my server hardware, but are forwarded via Docker to Caddyserver. To work, I have to land on the FORWARD chain, where DOCKER-USER already is. Very strange, since I had specifically specified chain = DOCKER-USER in jail.local. Something must be overriding this definition.
An inconspicuous forum post together with the multiport comment in the iptables printout led me to the solution: The action = iptables-multiport directive overrides my chain = DOCKER-USER statement, because the following is set in the corresponding configuration file iptables.conf: chain = INPUT.
So I simply delete the action entry, so that fail2ban reverts to the default for DOCKER-USER: multiport dports 80,443.
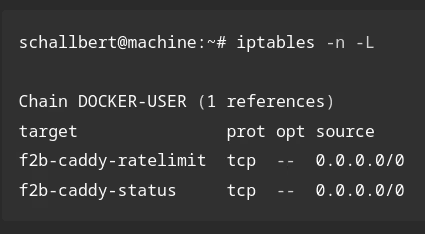
Now the jail name also appears correctly in iptables.
schallbert@machine:~# iptables -n -L
Chain DOCKER-USER (1 references)
target prot opt source destination
f2b-caddy-ratelimit tcp -- 0.0.0.0/0 0.0.0.0/0 multiport dports 80,443
Finally, another link check shows that my rate limiter is working.