Gitea crashes: Too many requests
Here I’d like to briefly describe how a service crash repeatedly paralyzed my server for hours. So badly that I could only restart it from the provider’s console. I’ll explain how it happened and how I intend to avoid this and similar problems in the future.
I was attacked. Or was I?
I was working on an article that I wanted to post later. To be on the safe side in terms of backup, I created a commit as usual and wanted to push it to my Gitea instance. But my git push command simply didn’t work.
Confused, I tried to access my website. The response was:
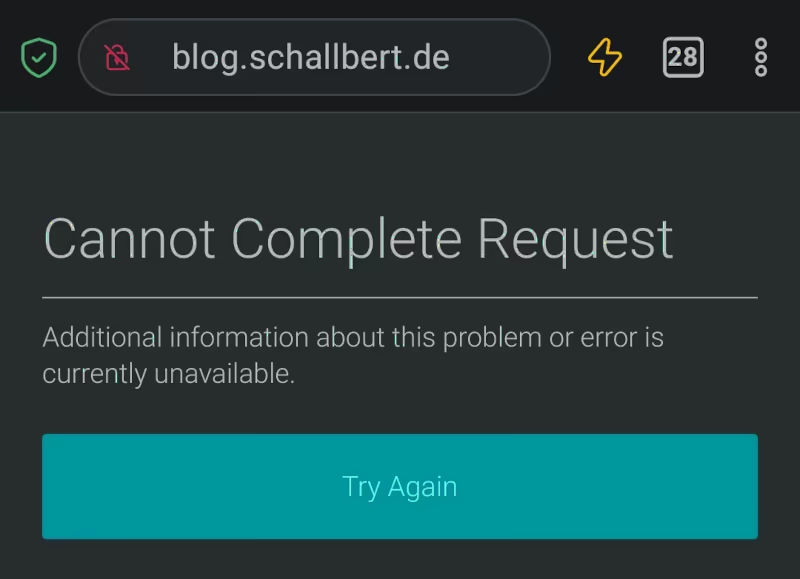
Strange. Then I wanted to log in to my server to check everything was OK: ssh <servername>. Again, the terminal remained unresponsive. Bummer!
Timeout. As a last resort, I logged in to my hoster’s web interface and looked at the server’s graphs:
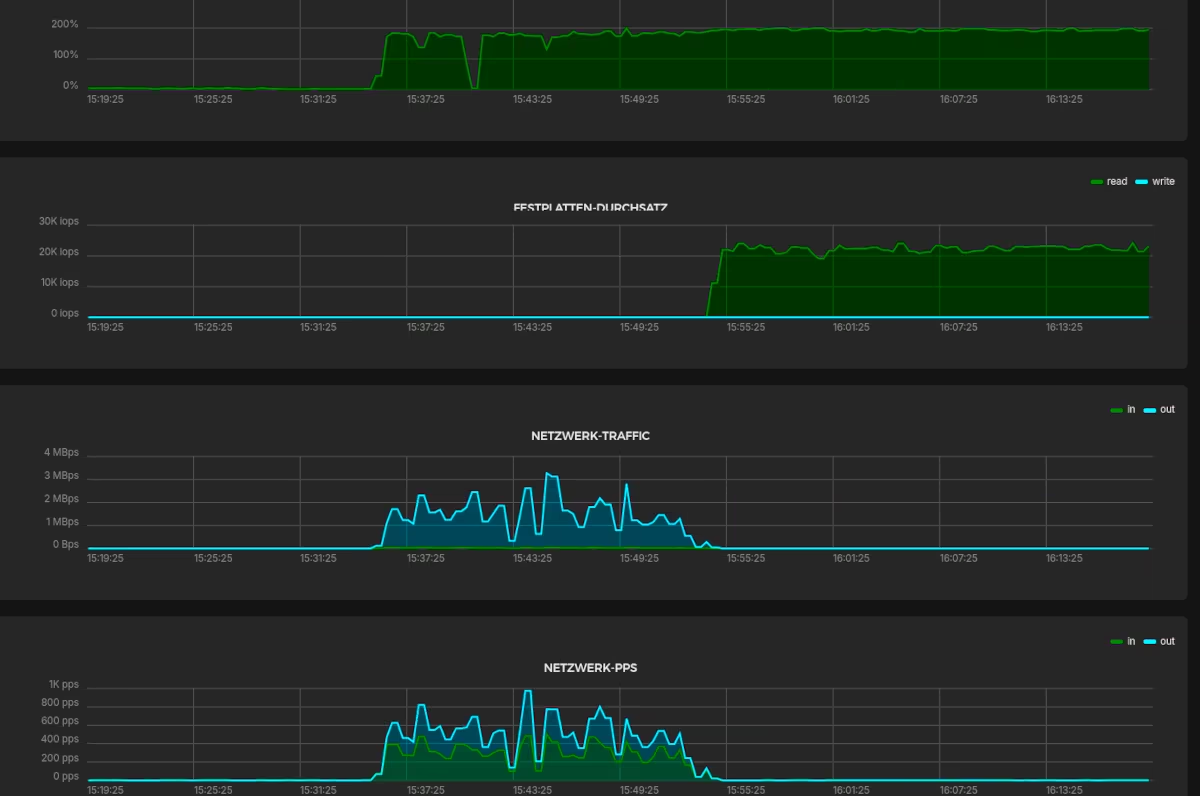
Oh, what’s going on? I’m trying to shut down the server via the web interface. That doesn’t work either. Only a hard reboot succeeds. I can log in again via SSH and see that all Docker containers are booting up normally.
What happened?
It’s a good thing I keep all the logs for a week. This, along with the machine’s utilization over time, allows me to reconstruct what happened. At least to some extent.
Which logs help?
- Localize the crash! Find the triggering application in the
kern.logand note the timestamp. - Are there system-wide effects or other services being affected? Check the
syslog. - If you suspect the system may have been hacked,
auth.loghas the details. - If the affected application is running in a container, the relevant logs there may be helpful.
- Review the application’s logs. The time just before the crash is particularly interesting.
And here again, in detail, are the logs I reviewed for my behavior and where they can be found.
| log name | purpose | relevant content for this issue |
|---|---|---|
| /var/log/syslog | System-wide (bare metal) messages | (docker) warning: “health check for container <ID> timeout” (containerd) error: “ttrpc: received message on inactive stream” |
| /var/log/auth.log | Contains authentication messages from external hosts, in my case mostly SSH | None |
| /var/log/kern.log | Logs all app, service, daemon and system crashes | Out of memory: Killed process <ID> (<serviceName>) |
| [.]/gitea/log/gitea.log | Protocol for requests, actions on Gitea’s web interface, repo changes etc. | GET requests, crash/restart indications |
docker container logs <containerID> |
Docker’s logs for the container in question | Received signal 15; terminating. (SIGTERM) |
kern.log/syslog
Here, next to the stack trace, I can see exactly what happened. The most understandable message is the following:
Out of memory: Killed process `<ID>` (gitea)
So, Gitea was unplugged because it had consumed practically all system resources. If I scroll up in the log, I see a few minutes earlier:
<timestamp> <machineName> dockerd[716]: level=warning msg="Health check for container <ID>"
<timestamp> <machineName> dockerd[716]: level=error msg="stream copy error: reading from a closed fifo"
Already here, I see warnings that the gitea container isn’t working properly. Another advantage of including “health checks” in the docker-compose.yml file. For other reasons, I’ve already written an article about the purpose and implementation of health checks in docker.
gitea.log
The following log entry indicates that Gitea has just been restarted due to a bug in a submodule:
cmd/web.go:205:serveInstalled() [W] Table system_setting Column version db default is , struct default is 1
And further up in the log:
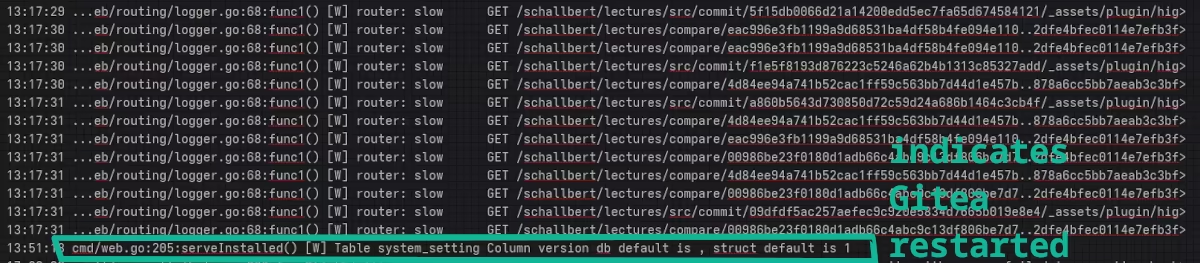
Very interesting. The highlight.css is in my public repo. It’s the scheme for lectures.schallbert.de’s appearance. This file is quite large, almost 1 MiB. And it’s loaded here dozens of times, practically for every commit.
Now I’m looking at other crashes in the past. It’s always bursts of GET commands for large files or requests for compares between two branches of the repository that precede my server crashing.
Who’s behind this?
All crash-triggering requests come from the same IP address range. The crashes started a few weeks ago. But mostly at times of day that I(and apparently many of my readers) didn’t notice. And after a few minutes, the server was always back to normal operation.
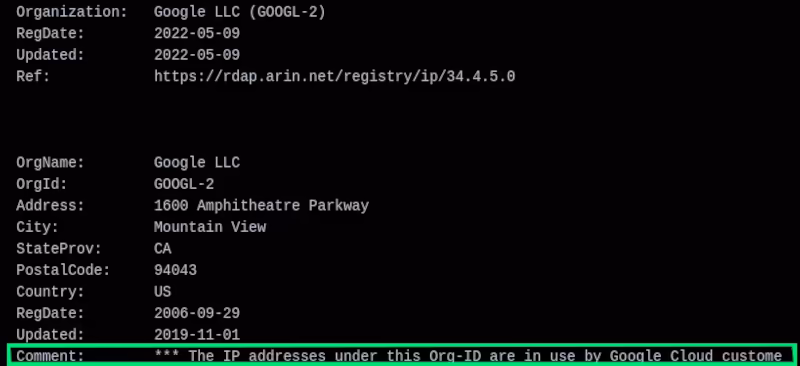
Oh, the trail leads to Google’s Cloud Platform (GCP).
But I had blocked robots?
Indeed, I had stopped the search engine indexing for Gitea. Strange. Or am I not dealing with one of the Google spiders or “AI” scrapers, but with a nasty hacker who rented a virtual machine from “Google Cloud”?
Log research: How frequently is the file requested?
A spider would only crawl all my pages once every few weeks, right? And hopefully not ignore my robots.txt. A crawler certainly wouldn’t make the same request multiple times and at short intervals, would it?
To check this, I search the Gitea logs for entries of GET requests to one of the large and therefore resource-intensive files to transfer:
gunzip gitea.log.<date.rotateID>
grep "<filename>" gitea.log.<date.rotateID>
In the list, I see that the same request to the same target file is made multiple times from the same IP address, all within seconds. Shortly before the crash, my server took almost 4 seconds to serve the request.
I also see that the IP address changes every few hours.
Countering a DoS Attack
In summary, I have to conclude that I’m being attacked via a Denial-of-service attack from the GCP address space.
To gather a bit more background information, I visit a few websites on the topic. There, I learn that gitea on my server is crashing under an Application Layer Attack. Now that I know what’s happening and what the problem is, finding solutions is much easier 😅
Of course, I don’t want to give up without a fight by permanently taking my Gitea instance offline. So, what options do I have?
Provide more resources
Admittedly, my machine only has 40GB of memory and 2GB of VRAM, as well as a measly 2-core CPU from 2009. I could book a more powerful server to better handle peak loads. But this wouldn’t prevent the attack, only mitigate its effects.
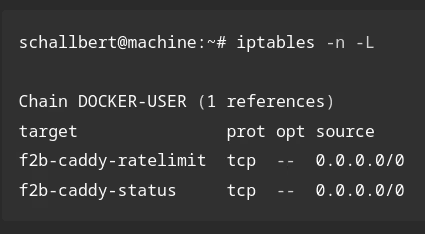
Rate limiting directly in the web server
Rate limiters limit the number of requests a client can make within a certain time window. This conserves server resources. This is a “soft” defense against DOS attacks, as triggering IP addresses are briefly and gently blocked with an error message. Typically, HTTP status code 429 “Too Many Requests” is returned when the limiter intervenes.
Gitea doesn’t have a rate limiter. In my setup, Gitea runs behind a reverse proxy provided by my Caddyserver. So, that’s where I’d have to start. For Caddy, rate limiters are only available as external modules, which must be manually installed and configured in xcaddy.
Blocking with IP-table rules
Here, you could again use fail2ban and simply block multiple requests for the same resource from an IP address. Gitea has a description of the setup in its documentation. In my case, I would have to continue where I left off, and thus monitor not only SSH but also normal page requests.
This solution sounds the most sensible to me, as it clearly separates concerns into different applications. I only use applications I already have available: Caddy would provide the access logs, and fail2ban would have to read them and set filters in the jail.local configuration so that it acts like a rate limiter.
Let me link the follow-up article Setting up Fail2ban with Caddy here 🙂