Sending error logs
In this article I’ll look at how to set up “monitoring” for my server. Applications and services should be able to send me notifications in the event of an error.
What is this about?
- Learn about and select sending mechanisms
- Write test messages and verify the automation
- Automatically send error report from Borgmatic
- Send runner logs through Gitea
- Notification when logging into my server via ssh
- Create and send logs for server updates / server errors
Verification and monitoring
After running an automation, I want to know whether it was carried out successfully and whether all programs and services started their work as expected. This should apply to any automation - whether it is specifically sending an update, creating automatic backups or an action from Gitea, it doesn’t matter.
Normally I would use reporting mechanisms from act_runner for something like this. In the case of a server update, the runner is not available due to the circular reference already mentioned in the article Rolling out the server configuration, as all applications have to be shut down temporarily.
In addition, applications may have their own procedures for monitoring. So I have to look at mechanisms that allow me to easily access the information.
What characterizes good monitoring for me?
- It is unobtrusive, so it only reports in the event of an error or unusual occurrence.
- It provides specific information and error messages that are easy to understand.
- It uses a message channel that works even if the system being monitored crashes.
- It presents reports and error messages in isolation from other topics and does not mix anything.
- It is brief.
Methods of automatic reporting
I will break this section down. In the general part, I will discuss the on-board tool for asynchronous monitoring that is available to me on the Ubuntu server. After that, I will look at the solutions that are partly built into my services or the applications that are compatible with them. I do not want to limit myself to the classic tool of email, but also look at “more modern” communication channels such as messenger programs or RSS feeds.
Mail via console - curl
Sending emails as notifications is common practice in many companies. With Linux, this can usually be done without any additional programs: The standard curl can help here.
curl is a program for transferring data from or to a server. If I enter my blog as the target, I get the HTML page output as a text file on the console:
curl https://blog.schallbert.de
This made me notice how much unnecessary data my blog software generates. I’ll have to clean that up later. Back to the topic: You can also use curl to access any web backend - for example a mail server:
# copied from https://stackoverflow.com/questions/8260858/how-to-send-email-from-terminal
curl --url 'smtps://smtp.gmail.com:465' --ssl-reqd \
  --mail-from 'from-email@gmail.com' \
  --mail-rcpt 'to-email@gmail.com' \
  --user 'from-email@gmail.com:YourPassword' \
  -T <(echo -e 'From: from-email@gmail.com\nTo: to-email@gmail.com\nSubject: Curl Test\n\nHello')
This only works for my mail provider if I allow logins from external clients. Google, for example, calls these “less secure apps”. As described in my post Server configuration with Git, I’m not a fan of writing secrets into anything - so I would rather not use the direct route via curl.
Mail via console - mail, mailx, mailutils, swaks
If you don’t want to always provide all the configuration information for the server and secrets, there are various handy tools for the console such as mailutils or swaks. Here, the connection to the mail server is configured once using the tool and can be stored in environment variables, for example. The syntax varies from program to program, but an email always drops out at the end.
The only major disadvantage for me is that information domains are mixed up. I would not want another “report thread” in my emails that I’d have to search for in the mass of messages. Other notification media in contrast allow me to set an automatic expiration date so that they disappear from my list after a set time.
Create RSS feed
Unusual but possible: I could create the monitoring as an RSS feed like my blog (schallberts-blog-feed) has e.g. using a Jekyll instance and put it online as a website. This would be easy to subscribe to, were readable with practically any reader and I could even set it up separately for each application. But there are obvious disadvantages:
- High effort: Gitea runner with Jekyll instance, web server and subdomain required.
- Publicly available: Suddenly build processes, updates, upgrades and error messages are accessible to everyone.
- Error-prone: If Gitea, act_runner, my proxy or the web server crashes, I don’t get any reports.
With the last point at the latest, this option is out of the question for me. I want to get a report when my applications don’t do what they’re supposed to. Let’s take a look at the applications I already run and see how they tackle this problem.
borgmatic
Borgmatic is compatible with a lot of monitoring options. These include apprise, ntfy, healthchecks, cronitor, pagerduty, cronhub and grafana.
- Apprise is a library. It is open source and can be integrated into an existing application as a dependency. Like an adapter, it enables asynchronous communication between the application and various communication services such as SMS, mail, messenger (e.g. Signal), various home automation systems or the notification mechanism of various operating systems. The latter, however, only works on the local machine. The trigger for communication must always come from the application.
- ntfy is a push notification service. It is open source and can be self-hosted or used as a service via web application. Apprise, for example, supports ntfy as a communication service. The structure is quite simple and works like MQTT via publication subscription / broker client mechanism, but HTTP-based.
- Healthchecks is a service. It is open source and can be self-hosted. The service is there to monitor regular activities and can act as a dead man’s switch: If, contrary to expectations, there is no response from the monitored program, it can raise an error message itself. This can in turn be forwarded to various communication services.
- Cronitor is a monitoring solution and web application that, in addition to the notifications I need, provides a lot of analysis tools, performance measurements and metrics - mostly for money. There is a free “hacker” account with limited functionality, but this tool is also far too big and complex for me.
- PagerDuty sees itself as a commercial “operations” platform that provides “incident management”, automation, “business operations”, “AIOps” etc. It’s out for me straight away. At the latest when I read the word “AIOps” 😅
- cronhub looks like a commercial web application to me that, like Healthchecks, can create cron jobs, monitor them and report errors. It is of no interest to me because it does not seem to be open source and I could not host it myself.
- Grafana is an open source web application that can either be self-hosted or used as a cloud service. Although many larger companies and projects use the application, it is orders of magnitude too extensive and feature-rich for my purposes.
fail2ban
Fail2ban does not have an automation solution like borgmatic. It simply creates log files that need to be evaluated in order to obtain content for notifications. At the moment I cannot think of anything that I absolutely need to know about Fail2ban. So I am not creating any reports for this for now.
Gitea
Gitea allows the log files to be configured very precisely. Access logs can be written out separately from service logs, repository logs or action logs and then processed further. According to my research, Gitea only offers a mailer as a notification system. In my opinion, this is primarily intended for repository and action logs.
Here, too, it would be most beneficial for me to analyze the logs and create a report myself if necessary.
Server
I already roll out my server configuration files using a script. So, in the event of an error, I could redirect the logs to a file and attach them to a report in any channel.
In addition, successful logins on the server would be worth a message. Then I can immediately determine whether it was me or not.
Selecting the reporting program
I not only have to select a monitoring program, but also choose a communications service through which the reports are sent.
| Program | Advantage | Disadvantage | |
|---|---|---|---|
| curl | simple | configuration must be provided | |
| works super easily with ntfy1 | No monitoring if the server crashes | ||
| Onboard tools | |||
| no service required | |||
| Apprise | enables integration of the Signal API2 | Complex in interaction with external services3 | |
| no service required | |||
| Healthchecks | Can act as a watchdog/dead man switch | Registration required | |
| Can be hosted locally4 | Local hosting contradicts the watchdog concept |
I only have a small server with a few applications, so I keep it as simple as possible and choose Apprise for services like borgmatic, which come with this library anyway, and curl for those whose reporting mechanics I have to program myself.
Communication channel
| Program | Advantage | Disadvantage |
|---|---|---|
| SMS | High reliability | Registration required |
| Limited to a few characters | ||
| No attachments possible | ||
| No topics, domain mixing | ||
| easy to set up | Poor searchability | |
| RSS feed | Good sortability | Complicated to set up, error-prone |
| Client very lightweight | Local hosting contradicts watchdog concept | |
| Content publicly available | ||
| ntfy | Simple and lightweight | Registration optional for web use |
| Client purpose-oriented | Insecure: No encryption without registration | |
| Free for small users | ||
| Independent of your own machine | ||
| Signal | “Note to self” easy to set up | Setting up and configuring the Signal API complex |
| Independent of your own machine | Topics somewhat difficult to implement | |
| Useless if the server crashes |
SMS, mail and RSS feed are already out of the question for me due to some of the disadvantages already explained above. So that leaves ntfy and Signal. ntfy impresses with its simplicity: send an HTTP PUSH request to a self-defined “topic” and subscribe to it on your cell phone - done. It is also easy to expand, because with self-hosting I can later increase security if necessary (encryption) and control the sending behavior. Signal, on the other hand, requires a separate client with relatively complex configuration. In addition, the devices would have to be connected to the server and cell phone, so it is not easy to add new subscribers. On the other hand, the transmission is well secured end-to-end, I do not have to register and it is also free.
For now, I have decided to go for the less complex solution with ntfy.
Logging
Good. Now it’s clear that I’m calling home using curl and apprise via the ntfy service. Let’s see what content needs to be transmitted and how to make it as unobtrusive as possible, but still short and concise.
When should logs be sent?
- borgmatic: If a backup fails
- If I successfully log in to my server or Gitea
- After rolling out an update to the server configuration
- Docker: If an application fails or doesn’t start
- Gitea: Failed run of act_runner
What should I include in a report?
I want the classic “W questions” answered.
- When did it happen (time stamp)?
- Which application is reporting?
- What happened?
- Where (module, line of code) etc. did it happen?
- How many were injured (severity, recovery)?
A notification then looks something like this:
TIMESTAMP APPLICATION PRIORITY MESSAGE EFFECT DETAIL
Rough version of a report
An ntfy message could look something like this:
curl \
  -H "Title: Error Borgmatic" \
  -H "Priority: urgent" \
  -H "Tags: warning" \
  -d "YYYY-MM-DD HH:MM:SS Backup creation aborted. Access to repository blocked" \
  ntfy.sh/schallberts-topic
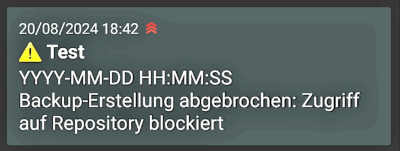 I install the corresponding app on my phone, register on the “Topic” and send the message. It’s nice when things just work!
Aha, the app shows the time of receipt. That’s accurate enough for me.
I install the corresponding app on my phone, register on the “Topic” and send the message. It’s nice when things just work!
Aha, the app shows the time of receipt. That’s accurate enough for me.
Implementation
Here I’ll take a look at all the services for which I’d like to set up notifications one by one.
borgmatic
Let’s start with a pilot test in small steps. First I configure Borgmatic to send a message via Apprise to ntfy if the backup creation fails:
# /borgmatic.d/config.yml
on_error:
- echo "Error while creating a backup."
- apprise -vv --title "Borgmatic Error"
--body "Could not run {output}. Aborted {error}."
ntfy://schallberts-topic
Then I test the command by calling apprise within the Borgmatic container. And indeed, it works. But getting here took me an hour, as the yml with its syntax rules even interprets within strings and borgmatic constantly refused to read the configuration file due to : and - characters. If you see an error similar to this one:
At 'on_error[1]': {'apprise -vv --title "Borgmatic Error" --body "Could not run {output}': 'Aborted {error}." ntfy://schallberts-topic'} is not of type 'string'
This shows that the interpretation of characters or indentations went wrong and the punctuation needs to be checked. Alternatively, the pipe operator | can be used to combine a command. Reference: yml specification
Server
An application of ntfy to monitor logins on a server can already be found in the documentation of ntfy itself. The description shows that something like this is easy to implement yourself and gives a great example using Pluggable Authentication Modules (PAM library).
Insert the following code at the end of the sshd file in the etc/pam.d directory:
session optional pam_exec.so /usr/bin/ntfy-ssh-login.sh
This line tells PAM that when a session is opened via ssh, it should call the executing module pam_exec, which then runs the script specified below. The value optional means that the configuration file should continue to be run even if the action fails. More details on how to use PAM can be found, for example, on Baeldung.
Then you simply have to store the ntfy call in the ntfy-ssh-login.sh script when the script determines that PAM has detected an open_session event.
That’s exactly how I implemented it and it works straight away. Great! The only disadvantage: I made this modification directly on the server. Without a container and outside of my configuration backup. If I now have to set up the server again for some reason, the change in PAM is lost and I won’t receive any more notifications until I manually enter the change again.
Server configuration
To send a report after running the configuration automation, I actually only have to adapt the server-config-action script that I wrote in the last article.
First, I want to be informed when the script runs without errors. To do this, I add a curl command at the end of the file.
# server-config-action.sh

# action commands...
# [...]
# send success notification
curl \
    -H "Title: server-config-action" \
    -H "Priority: low" \
    -H "Tags: white_check_mark" \
    -d "Rollout successful" \
    ntfy.sh/schallbert-server-config-push-topic
However, if the script does not run without errors, I would like to do the following:
- Cancel actions after the error occurs
- Create an error log
- Send this log
I can achieve the first point by adding a trap for errors:
# server-config-action.sh
trap 'handle_error $LINENO' ERR

# action commands...
This calls the function handle_error. It is given the line number where the error ERR occurred. It also covers errors that can occur when restarting the container. I create the error log by redirecting the output of the individual script commands. I achieve this with the following line:
# server-config-action.sh

exec 3>&1 1>server-config-action.log 2>&1

# action commands ...
With this command, any standard output stdout should be passed on to the file descriptor 3, specified here with the log file server-config-action-log, overwriting it. For “append” there would have to be two redirection operators >>5. The log file thus replaces the console output, which I still had at this point in the previous article.
To have the log sent to me, I now define the following function at the beginning of the Bash script:
# server-config-action.sh
# on error, send a notification
handle_error() {
    # stop redirecting to file
    exec 1>&3 1>&2
    curl \
        -H "Title: server-config-action FAILED" \
        -H "Priority: high" \
        -H "Tags: x" \
        -T server-config-action.log \
        -H "Filename: server-config-action.log" \
        ntfy.sh/schallbert-server-config-push-topic
    exit 1
}

# set error trap
# redirect stdout and stderr to file
# action commands...
Gitea
For Github Actions reports, there is already an existing example at ntfy_examples/#github-actions. And the best part: Since the act_runner from Gitea is compatible with Github Actions at in the environment parameters, sending to ntfy works for me straight away. In the runner’s workflow file, all you have to do is enter the curl command specified on the website and you’re done.
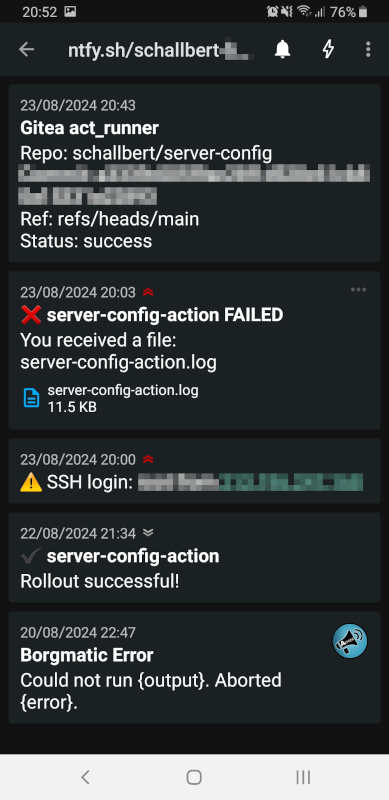
Result
Five notifications about the most important processes on my server have now been set up. I have understood the underlying mechanics and can create additional notifications at any time if I need them. If I trigger all notifications as a test, my smartphone will display the as shown.
But I have not yet achieved independence from the system to be monitored. All notifications come from the affected machine and there are sometimes even dependencies between Docker containers. For example, the act_runner has to connect to Gitea via websockets. And that only works if Caddy provides the reverse proxy.
If I find out in the next few months that a service “under my radar” is no longer able to work, I will have to establish independence.
-
Context for the Signal API ↩
-
Report by
asad-awadiaon setting up the Signal API ↩ -
Healthchecks is directly available as a Docker image. ↩
-
Incidentally, the operators
<<and>>are not difficult for me to remember, because I used to have a lot to do with the programming languageC. There - and in many other programming languages too - these are shift operators that can “shift” a value bit by bit or move one field to another. In the RISC architectures that I used at the time, the shift operation was “cheap”, i.e. very fast and memory-saving. ↩